

An infographic can bring a local business referral visitors, mentions and sometimes editorial links. It cannot guarantee backlinks or customers. If someone pitched you a package, or you read that graphics earn links, the real question behind "do infographics help SEO" is whether this one would be used by anyone beyond your own website.
That depends on the topic, the page the graphic sits on and the people who might reference it. The design is the smallest part. A well-drawn poster about why your company is the best choice gives a newspaper, a library or a neighborhood group nothing to cite.
You can test your idea alone in about ten minutes, before you pay for any design. The result is a clear go or no-go, and a list of what a finished page needs if the answer is go.
Key Takeaways
Write one fact-based question customers repeat, its source, its geographic scope and date, and three organizations such as a newspaper, chamber or library that might reference it. If you cannot, skip the graphic.
Give the graphic a real HTML heading, short alt text that describes it, and a complete text version or data table, because WCAG 2.2 calls for text alternatives to substantive non-text content.
Track referral visits, inquiries, calls, bookings and sales alongside links. Google treats links created mainly to manipulate rankings as spam, so never buy or swap them to make the count look good.
Find out in ten minutes whether an infographic is worth making
Google says links earned because people find your content useful and choose to reference it are normal. Its SEO Starter Guide adds that links from other sites can happen naturally and that you are free to promote your content so people find it. An infographic can be that kind of content. Publishing one is not the same as earning anything, though.
Run this test with a pencil and the person who answers your phone. If you can fill in all five lines, the idea has a chance. If you cannot, you have saved the design fee.
The ten-minute topic test
Write down a fact-based question your customers ask again and again, such as what a homeowner should do before the first freeze.
Name where the answer comes from, then add the geographic area it covers and the date it applies to.
Pick someone beyond your current customers who needs the answer, such as new residents, renters or parents.
List three realistic places that might reference it, such as a local newspaper, the chamber of commerce, a library or a neighborhood association.
If the only subject you can find is why your business is better, the graphic is promotional and not a likely reference.
Keep the page you write the answer on simple. The same facts, in plain text, are a perfectly good asset on their own, and that is worth knowing before you spend anything.
Choose a topic that a newspaper, chamber or library could use
The topics that earn a mention answer a repeated question with information someone can check. Think of a seasonal home-maintenance checklist, a storm-preparation checklist, a local permitting or preparation guide, an event-planning calendar, or a visual explanation of recycling and disposal rules. A comparison of regional service costs works too, if you name your assumptions clearly.
Possible linkers include local newspapers, chambers of commerce, neighborhood associations, libraries, schools, trade groups, municipal departments, nonprofits, clubs and complementary businesses. Each one has an audience, and your topic has to be useful to that audience, not merely carry your company name.

Own or verify the data underneath. State the geographic area, the date, your definitions and the limits of what the numbers show. Google's guidance on people-first content is the standard to hold the page to: written to help a reader, with a clear source behind it.
If you are also working on links more broadly, our guides to getting backlinks for a small business and to local link building through sponsorships, events and partners cover the rest.
Build the page so people, screen readers and Google can all use it
A finished infographic is a web page with a graphic on it. The graphic carries the quick read. The page carries everything else. WCAG 2.2 Success Criterion 1.1.1, explained in the W3C's Understanding Non-text Content, asks for a text alternative for non-text content that conveys substantive information. A graphic full of figures and steps qualifies.
Alt text is the short part. Google's image guidance says Google uses alt text, computer vision and the page content to understand an image, and that alt text should describe the image usefully without keyword stuffing. Its example of good alt text is "Dalmatian puppy playing fetch." The full information belongs in ordinary HTML text near the image.
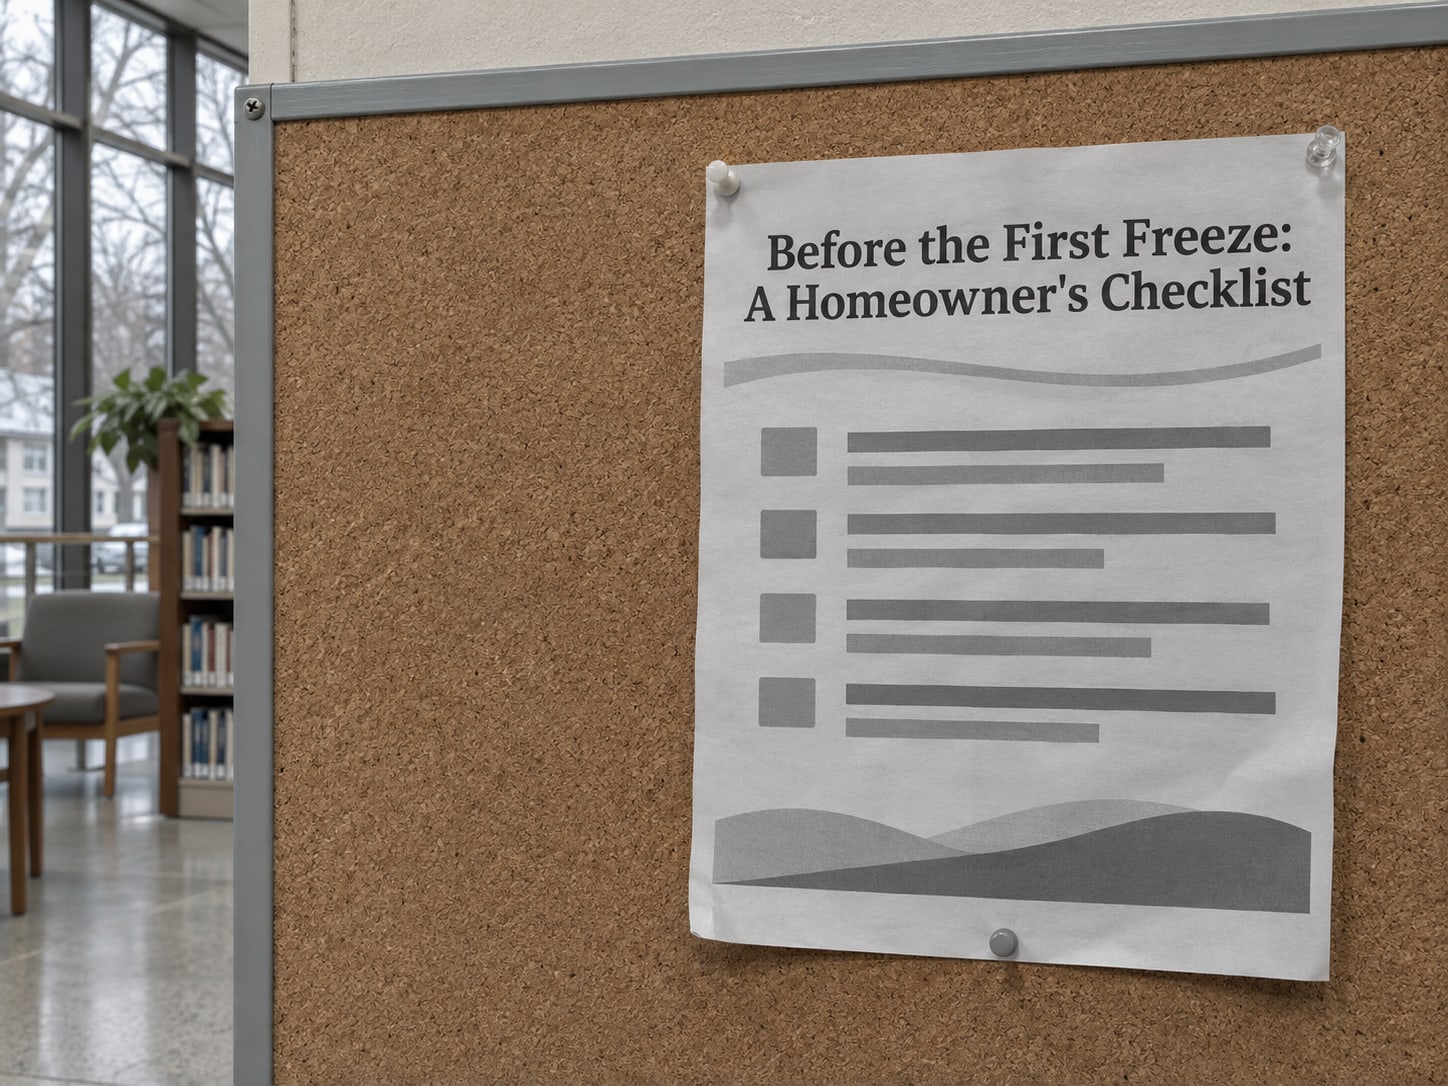
Charts and diagrams may need both a short description and a longer text alternative, because a short alt attribute cannot carry every value or relationship. Use real heading elements rather than text that only looks large or bold. Mark purely decorative images with an empty alt attribute so assistive technology skips them.
| Piece | What it looks like | Why it is there |
|---|---|---|
| Real HTML heading | A true heading element that names the topic | Gives screen readers and search a clear section to find |
| Short alt text | One plain sentence naming what the graphic shows | Google reads alt text, and keyword stuffing does not help |
| Full text version or data table | Every figure, step and label from the graphic, as page text | WCAG 2.2 calls for an equivalent of substantive non-text content |
| Date, area and source | When the facts apply, where, and where they came from | Lets a newspaper or library check it before citing it |
| One next step | A call button, form or booking link | Gives a referral visitor something to do |
Make sure the graphic reads on a phone. If the text inside is too small to read without pinching, a smaller graphic with the rest in page text works better.
Share it with the people it helps, without buying a single link
Google's spam policies treat links created mainly to manipulate rankings as link spam. Its examples include buying or selling links, excessive link exchanges, automated link creation, paid articles that pass ranking credit and requiring links in contracts. Google's guidance on qualifying outbound links covers how paid links should be marked.
Infographic submission directories belong in that same pile. These are sites where you upload a graphic so it can sit with a link back to you. The link is one you made yourself, it sends no customers, and the tactic is dated. Set it aside, along with any package that promises a number of backlinks.
What works instead is plain and a little slow. Send the page to the three organizations from your test, with a short note on why their readers would use it. Say what the graphic covers and let them decide whether to reference it. Do not ask for a link in return for anything. Our guide to what link-building offers to refuse is a useful screen for any pitch that lands in your inbox.
Share it on your own channels too. Google Business Profile posts let you add an image with an update, an offer or an event on Search and Maps. Put the number on the "Call now" button instead of typing it into the post, since phone stuffing in post text is against the post policy.
Track what the graphic brought, not only who linked
A link count can rise while the phone stays quiet. A link from an unrelated site may matter less than one referral visitor who calls. Write down your baseline before the page goes live, then watch five things each month.
| What to watch | Where to look | What it tells you |
|---|---|---|
| Referral visits | Your site analytics, by source | Whether a mention sent real people |
| Inquiries | Form submissions and messages | Whether visitors took a next step |
| Calls | Your call log, plus asking each caller how they found you | Whether the page reached people who phone |
| Bookings and sales | Your booking system or invoices | Whether any of it became revenue |
| Links and mentions | A dated list of who referenced the page | How far the graphic traveled |
Give each outside organization its own tagged link when you send the page, so the visit shows up under the right source. Ask every new caller how they found you and write the answer down. A simple notebook beats guessing.

Agree on a review date before you publish, and compare the numbers with your baseline on that day. An editorial link, if one comes, depends on someone else's schedule, so judge the graphic by the visits and inquiries it sent as well.
Keep the money when the answer is no
An infographic is not automatically worth making. If you have no original information, no specific customer question, no realistic group to share it with and no way to measure a business result, skip the graphic or publish an ordinary text guide instead. A vendor should not promise a number of backlinks, rankings, shares or customers.
Good reasons to go ahead do exist. A graphic can make complicated information easier to follow, support a conversation with a customer, and give a local organization something useful to reference. When those fit your situation, the work can pay for itself in ways that have nothing to do with a link.
So, a responsible recommendation may be no infographic, a smaller one, or a text-first page with a simple chart on it. Ask any vendor which of those they would suggest for your topic, and what they would measure.

Is your infographic idea worth making?
Pick an answer to begin.
1. Which topic is likeliest to earn a reference from a local newspaper or library?
2. What does WCAG 2.2 call for when an infographic carries substantive information?
3. A vendor promises a fixed number of backlinks from your graphic. What should you do?
Frequently Asked Questions About Infographics and SEO
Can an infographic earn backlinks?
Yes, if people find it useful and choose to reference it. Nothing guarantees it. The topic, the evidence behind it and who sees it decide whether anyone links.
Do infographics automatically improve SEO?
No. An infographic is a format, not a ranking or a link. A page with useful, accurate information and a real text version has something to offer. A generic poster does not.
Can Google read the words inside an infographic?
Google uses alt text, computer vision and the page content to understand an image. Put the important information in ordinary HTML text so you are not relying on the graphic to carry it.
What should the alt text say?
A short, plain description of what the graphic shows, written for someone who cannot see it. Skip keyword stuffing, and put the full information in a text version or data table on the page.
Should I buy backlinks for an infographic?
No. Google treats buying or selling links, excessive link exchanges and automated link creation as link spam, and paid links meant to pass ranking credit need to be qualified.
How do I know whether an infographic brought a customer?
Track referral visits, inquiries, calls, bookings and sales, alongside links and mentions. Ask each new caller how they found you, and write down the answer.
Moving Forward
An infographic can bring referral visitors, mentions and sometimes editorial links to a local business, and none of it is guaranteed. The ten-minute test tells you whether the topic deserves a graphic. A finished page needs a real heading, short alt text and a full text version. Sharing is done by handing it to people it helps, and results are counted in visits and inquiries.
If the test says go, you end up with a reusable page that educates customers, supports your sales conversations and gives local organizations something to point to. If it says no, you keep the budget for something that will work harder, and you still have the answer to your customers' question written down.
If you want a second opinion before you commit, Web Leveling can look at your topic, your page and your tracking with you. Our search engine optimization work covers where a graphic fits into search visibility, and the page it sits on gets built to be fast and readable. We will tell you if a text-first page is the better move. We work with small and medium businesses across the country and overseas. Send us the topic you are considering, and we will help you make the go or no-go call.
Terms
Infographic and link words
Tap a term to see what it means.
Infographic. A graphic that presents facts, steps or data in a visual layout.
Backlink. A link from another website to yours.
Earned link. A link another site chooses to give you because it finds your content useful.
Link scheme. Buying, selling or swapping links, or creating them automatically, mainly to influence rankings.
Alt text. A short written description of an image, read by screen readers and used by search engines.
Text alternative. A written version of everything a graphic communicates, such as a full text version or a data table.